Use Enterprise Reports in Smartcat
Overview
Enterprise Reports gives you precise, insights-driven reports from your Smartcat workspace in a few clicks. This article shows you how to open, filter, and read your reports.
📌For AI-powered translation accuracy, see the Translation Quality Score.
Open the Reports page
To go to the Reports page, you have two options:
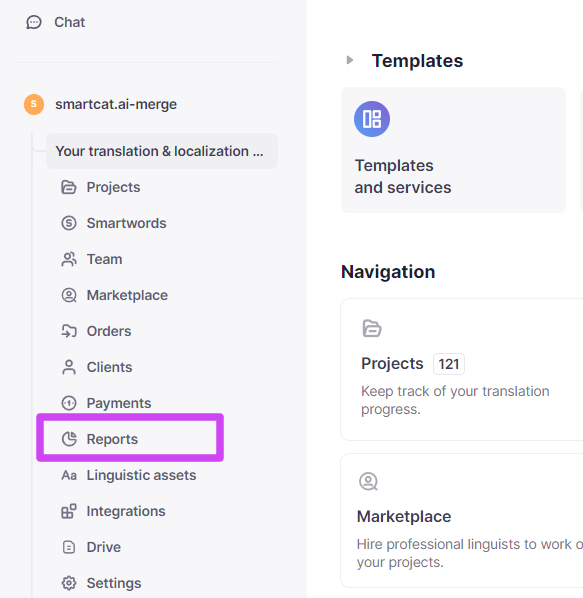
- Click the Reports button in the sidebar of your workspace home screen
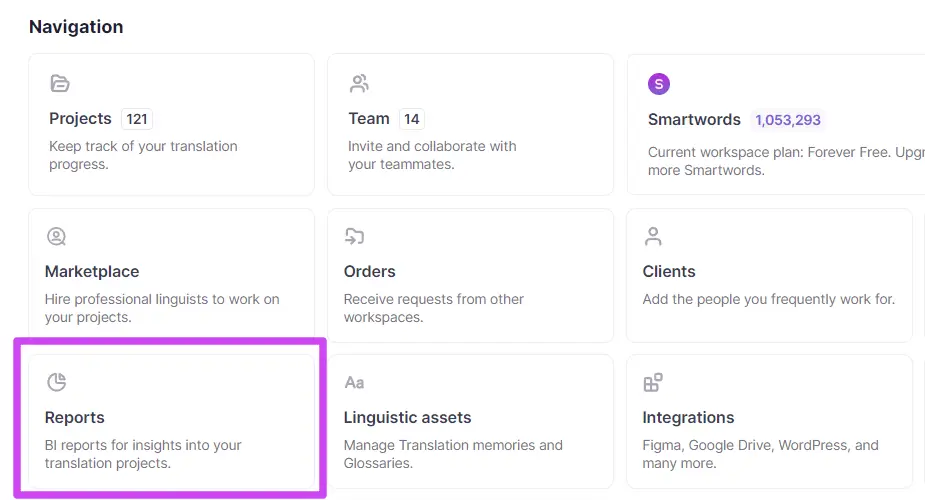
- Click the Reports shortcut in the Navigation menu on your workspace home screen
View the report dashboards
Open the Reports Dashboards section.
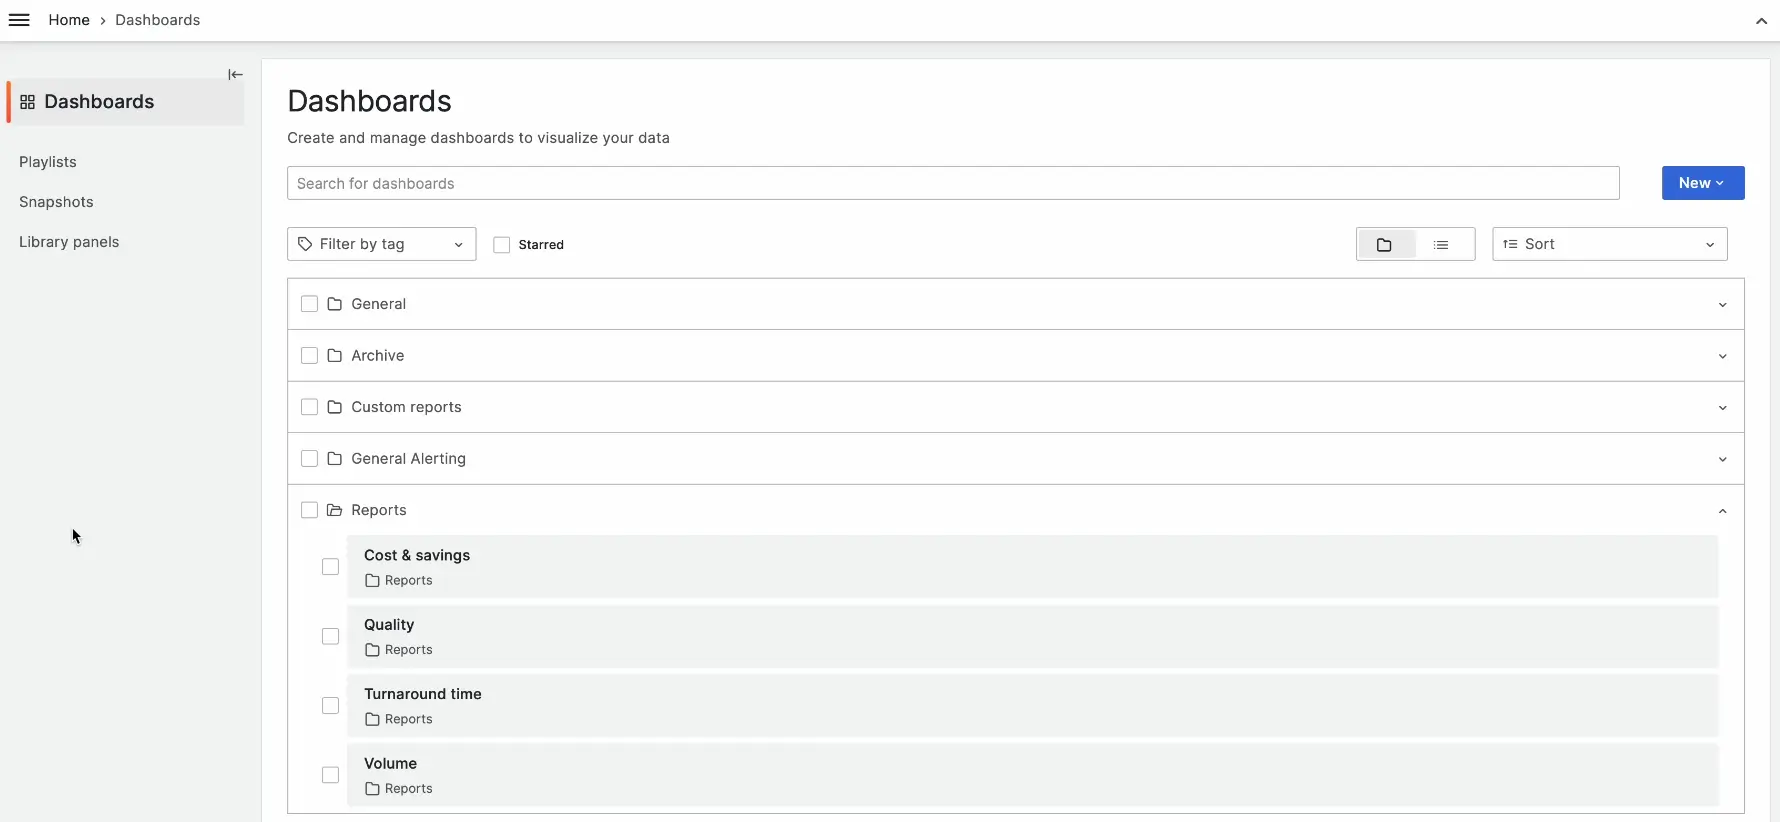
Four different dashboards are available.
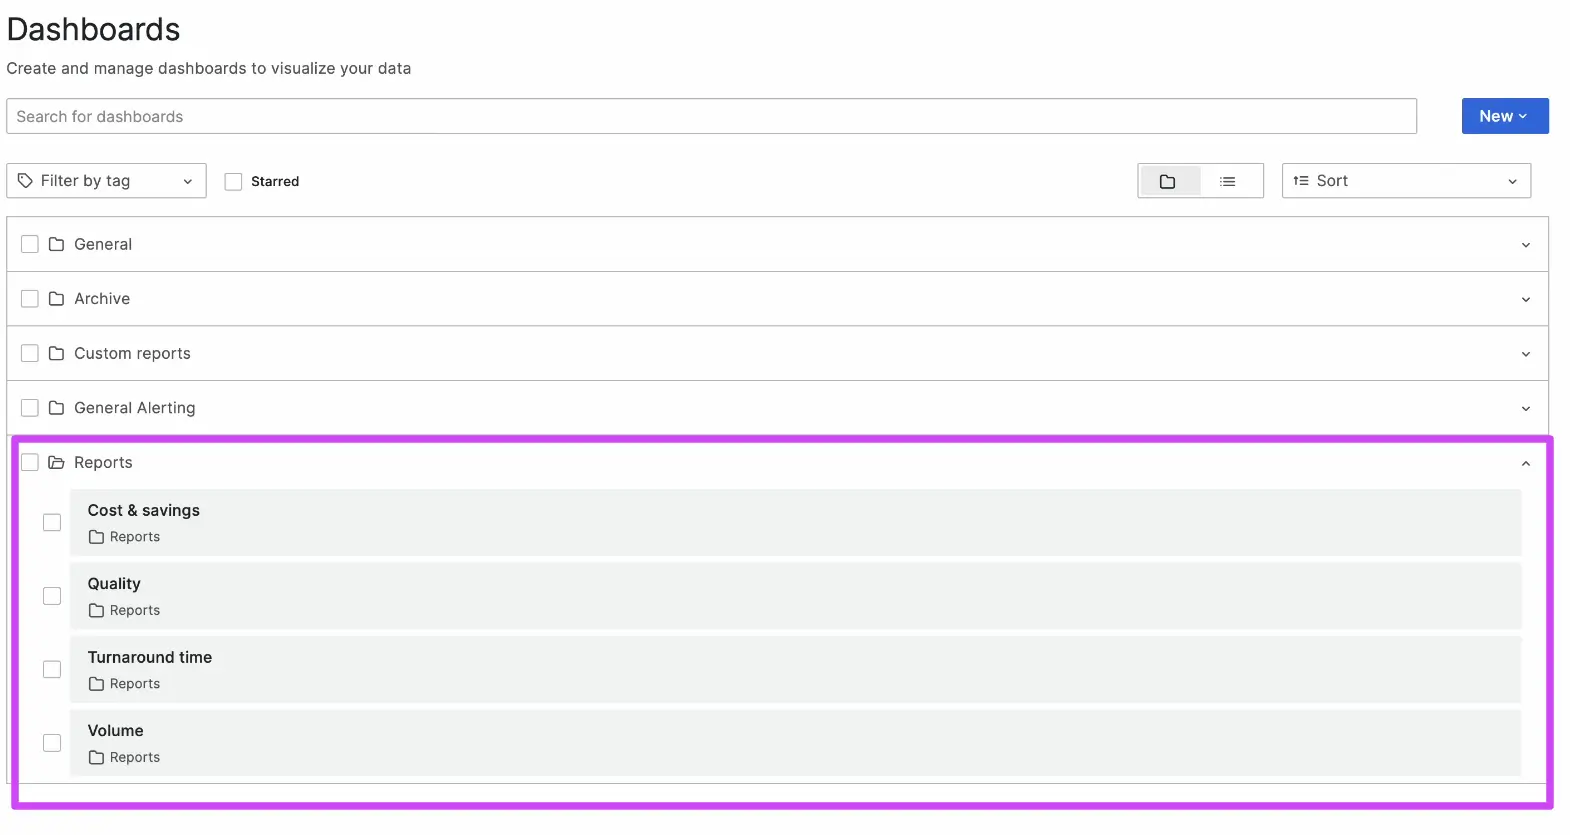
📌 Previous reports have been moved to the Archive folder. If you have customized reports, you'll find them in the Custom Reports folder.
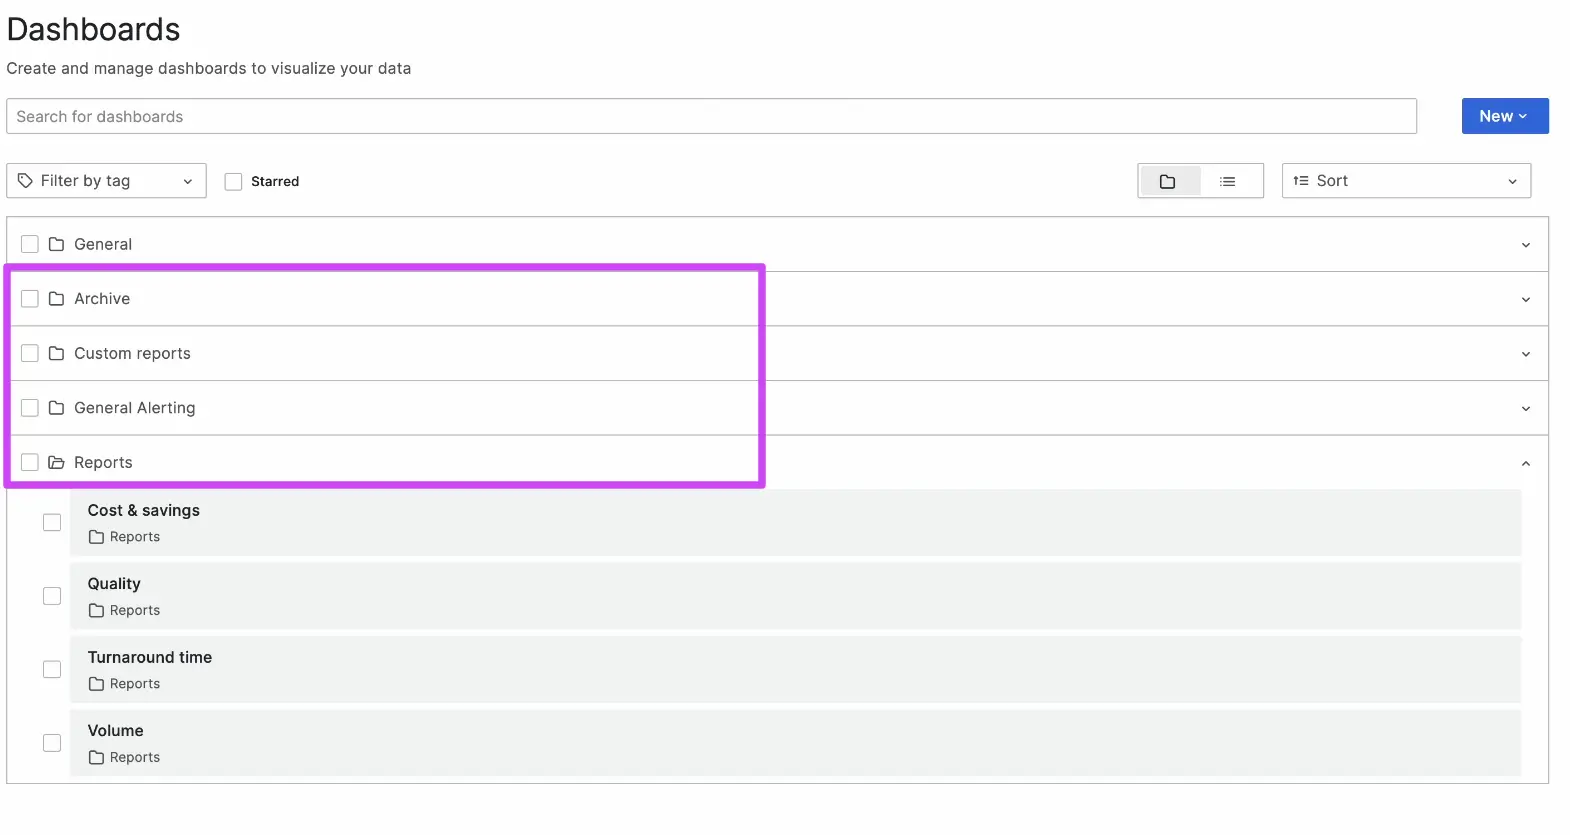
Click the folder to view the report you want.
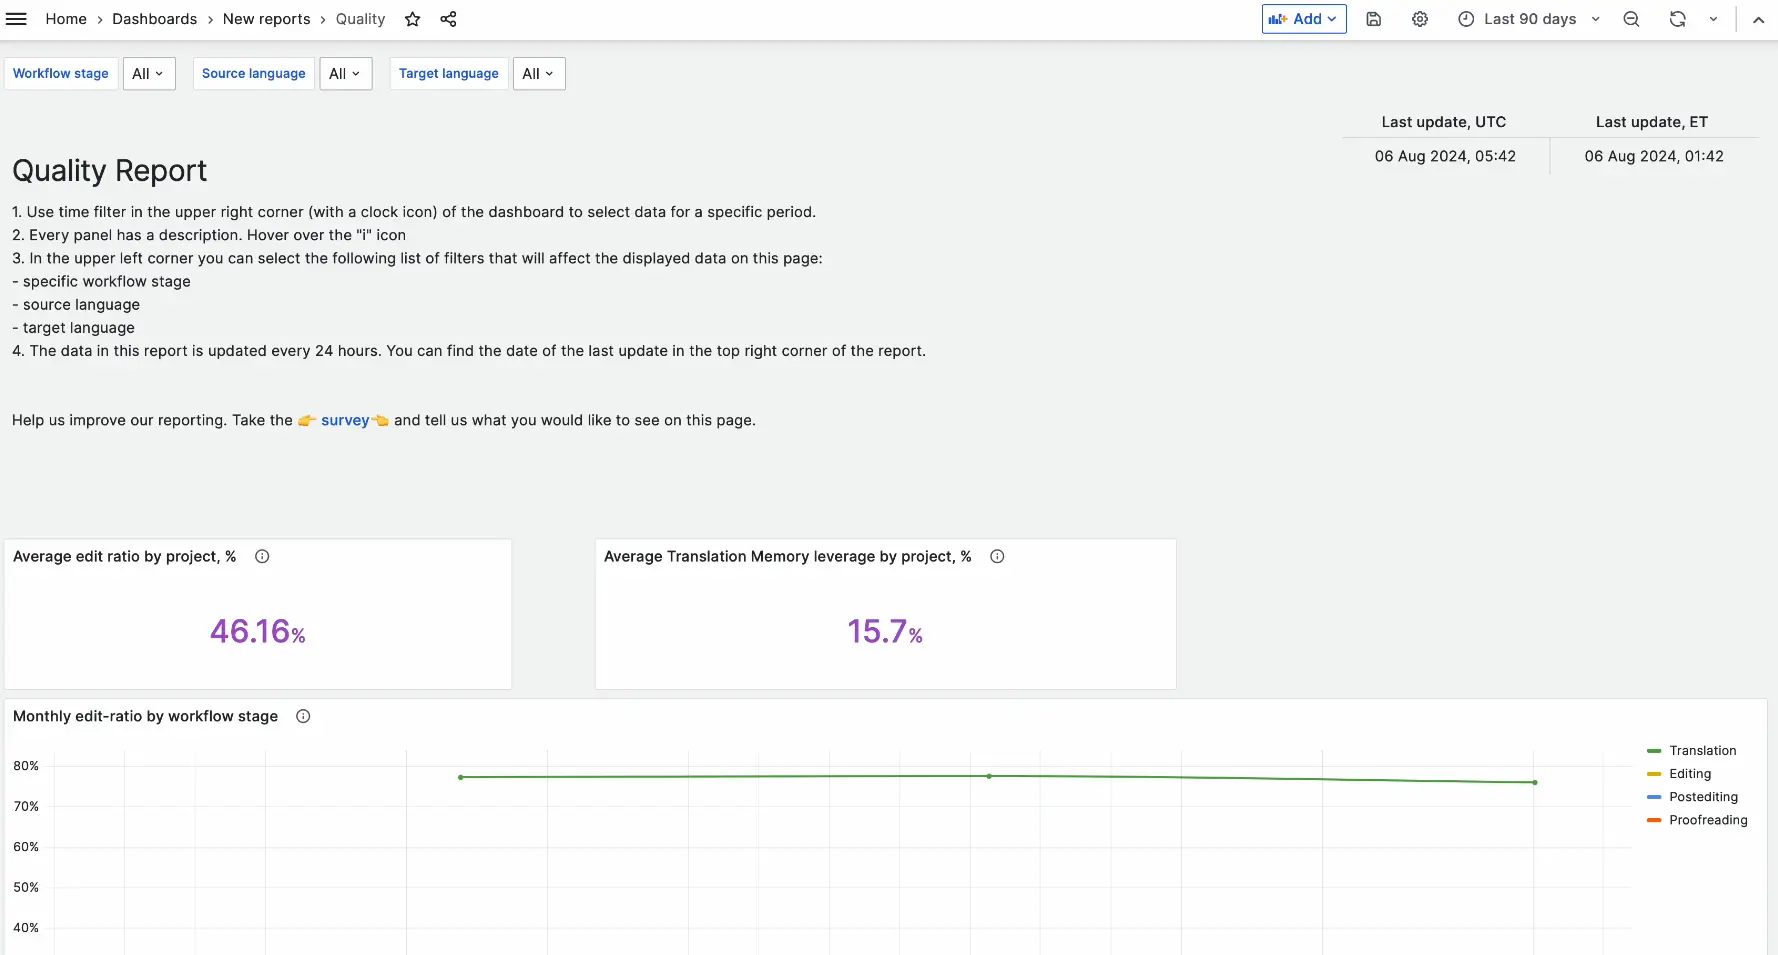
Filter and read a report
At the top, you'll find filters that let you manage reports by Workflow Stage, Source Language, and Target Language.
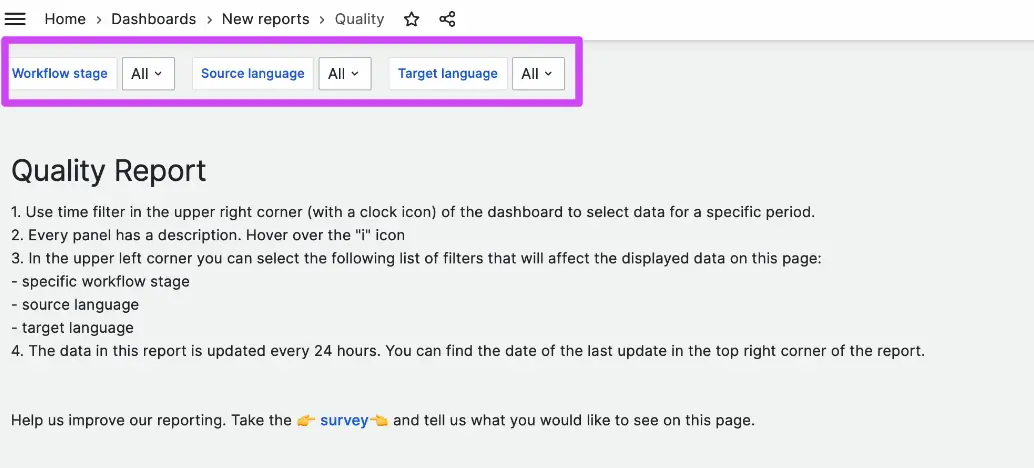
Below the filters, a description explains how they work.
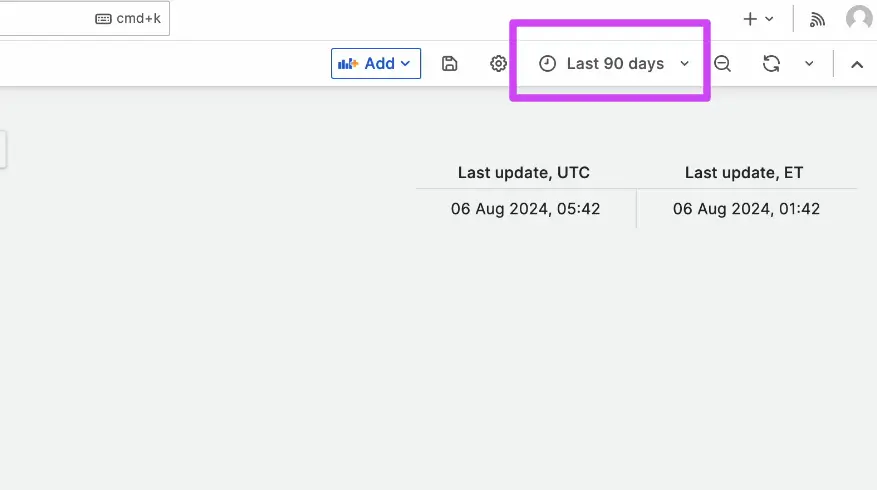
On the right, you can see the time of the last update. Above this, you can specify the desired time period for the data.
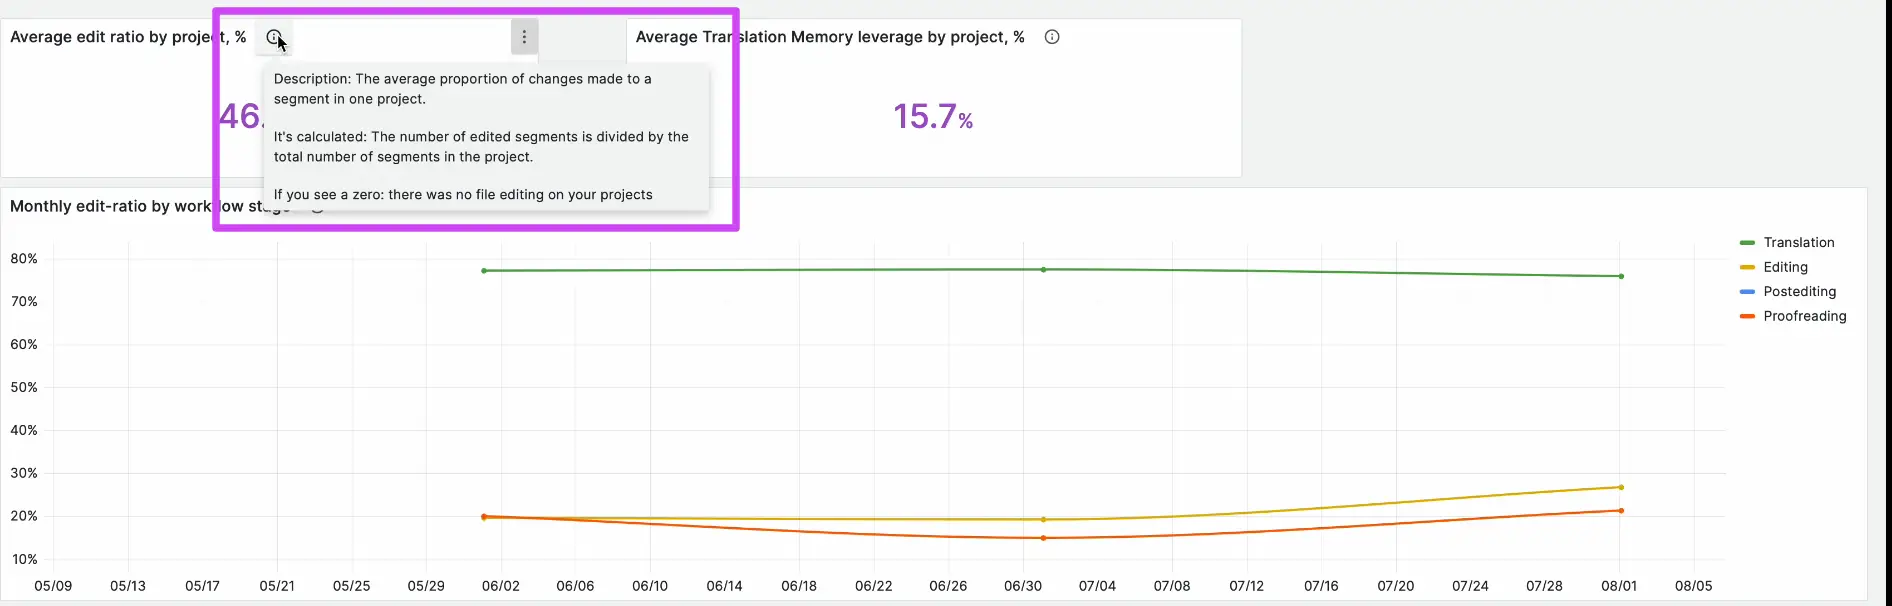
At the bottom of the screen, you'll find data points such as charts, tables, and figures. Each table is accompanied by an icon.
💡 Hover over the icon to see what is being displayed, how it was calculated, and possible reasons if certain parameters are not displayed.
To see a detailed report, click the specific tile.
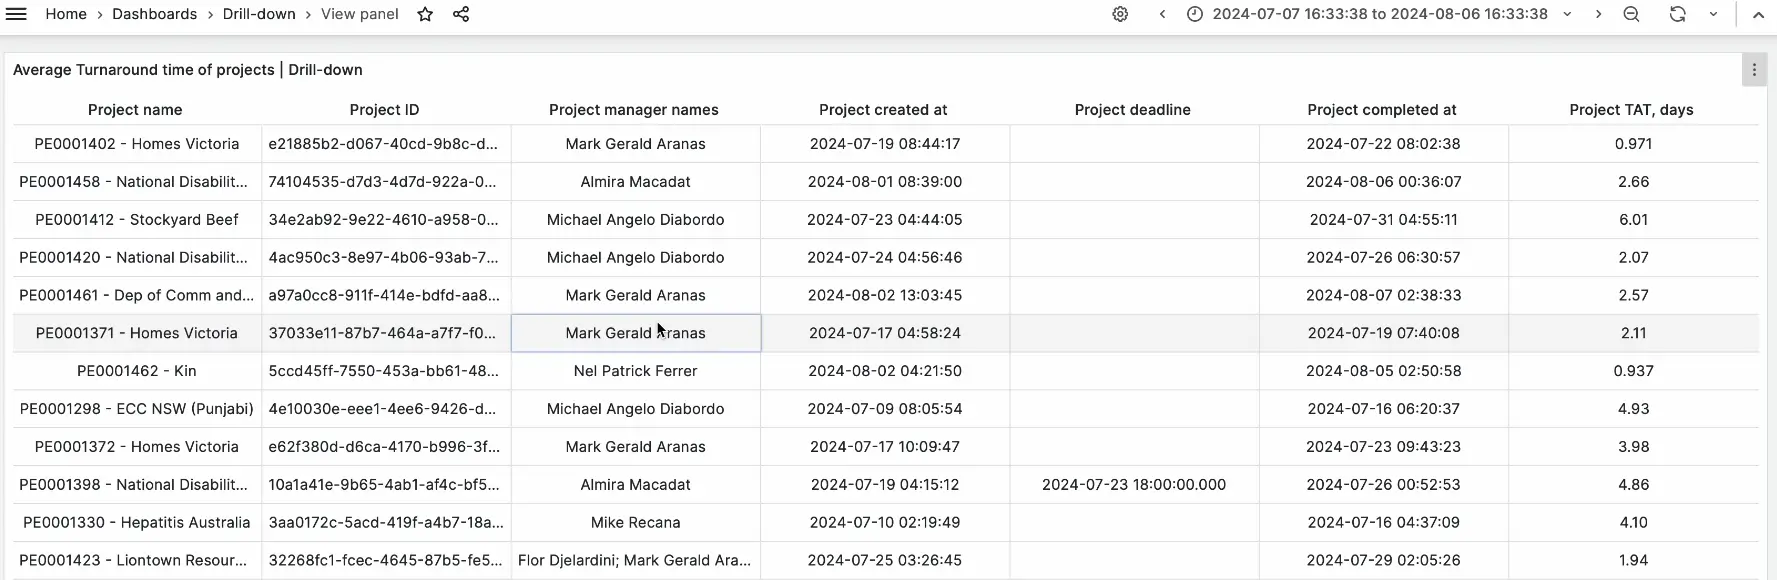
In the View panel tab, you can see a detailed report for each project.
After you open the dashboards, apply filters, and select a tile, you can review detailed report data for each project.
Share feedback
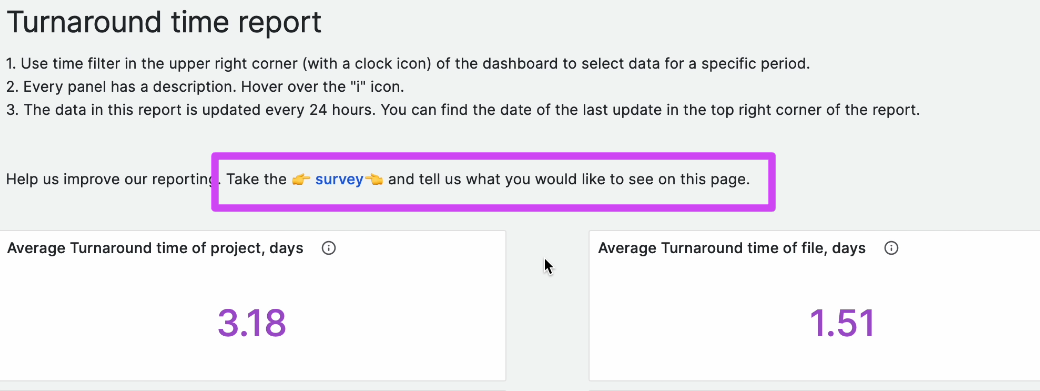
If you have any questions or suggestions about the reports, leave your feedback using the Survey button above the tiles.
FAQs
How many report dashboards are available in Enterprise Reports?
Four different dashboards are available in the Reports Dashboards section.
What can I filter a report by?
You can filter reports by Workflow Stage, Source Language, and Target Language, and you can also specify the time period the data covers.
Where can I find reports I previously relied on, or reports I've customized?
Previous reports have been moved to the Archive folder, and any customized reports you've created are found in the Custom Reports folder.
How do I see more detail behind a chart or figure in a report?
Hover over the information icon next to a data table to see what's being displayed and how it was calculated, or click a specific tile to open a detailed report and, from there, the View panel tab to see per-project detail.
Is Enterprise Reports related to translation quality scoring?
It's a separate but related feature — for AI-powered translation accuracy specifically, see the dedicated Translation Quality Score documentation; Enterprise Reports covers workspace-wide project and workflow reporting.
Want to learn more?
See how Smartcat can transform your localization workflow.
Still need help?
Our support team responds within one business day.